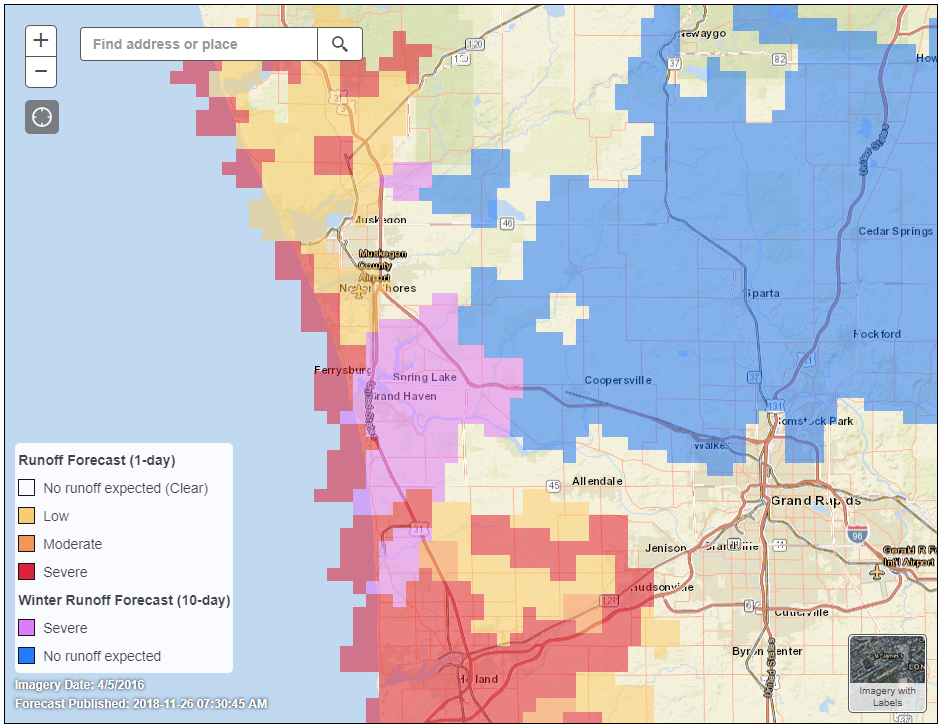
Using this Map
These maps are provided to help reduce the risk of runoff losses following manure nutrient applications. The forecast map divides the state into squares, each covering an area of 4 sq. km (988 acres). The larger overview map shows the risk of runoff over the next 24 hours. Each square has a seven-day runoff risk and precipitation forecast. The forecasts are updated once daily usually in the morning.
Interpreting the Map

Runoff risk categories over the next 24 hours:
1. No runoff expected (clear): There is little or no runoff predicted for that time period.
2. Low (light yellow): The risk of a runoff event occurring is minor.
3. Moderate (orange): The risk of a runoff event occurring is moderate. Use this information along with other factors to determine if there should be spreading.
4. Severe (red): The risk of runoff occurring in this grid is high. Use this information along with other factors to determine if there should be spreading.
Winter runoff risk categories over the next 24 hours/u>:
5. Severe (purple): The risk of runoff is predicted in the next day, with winter conditions existing. Runoff is predicted to occur while either the daily average snow depth is 1 inches or more or the 3-day average temperature of the top 2 inches of soil is below freezing.
6. Winter Conditions (blue): The risk of runoff occurring is likely in the future. Either the daily average snow depth is 1 inches or more or the 3-day average temperature of the top 2 inches of soil is below freezing.
Pop-Up Boxes Provide Details for Each Grid
To learn more about the runoff risk and forecast in your area; zoom in and click on the map to bring up a pop-up box for that particular grid area. The following information is displayed in the pop-up box:
1. Watershed Name
2. Precipitation Forecast (in inches) over the next seven days
3. Runoff Risk Forecast over the next seven days